Design approach as one chart
Wisdom Wheel
Wisdom Wheel
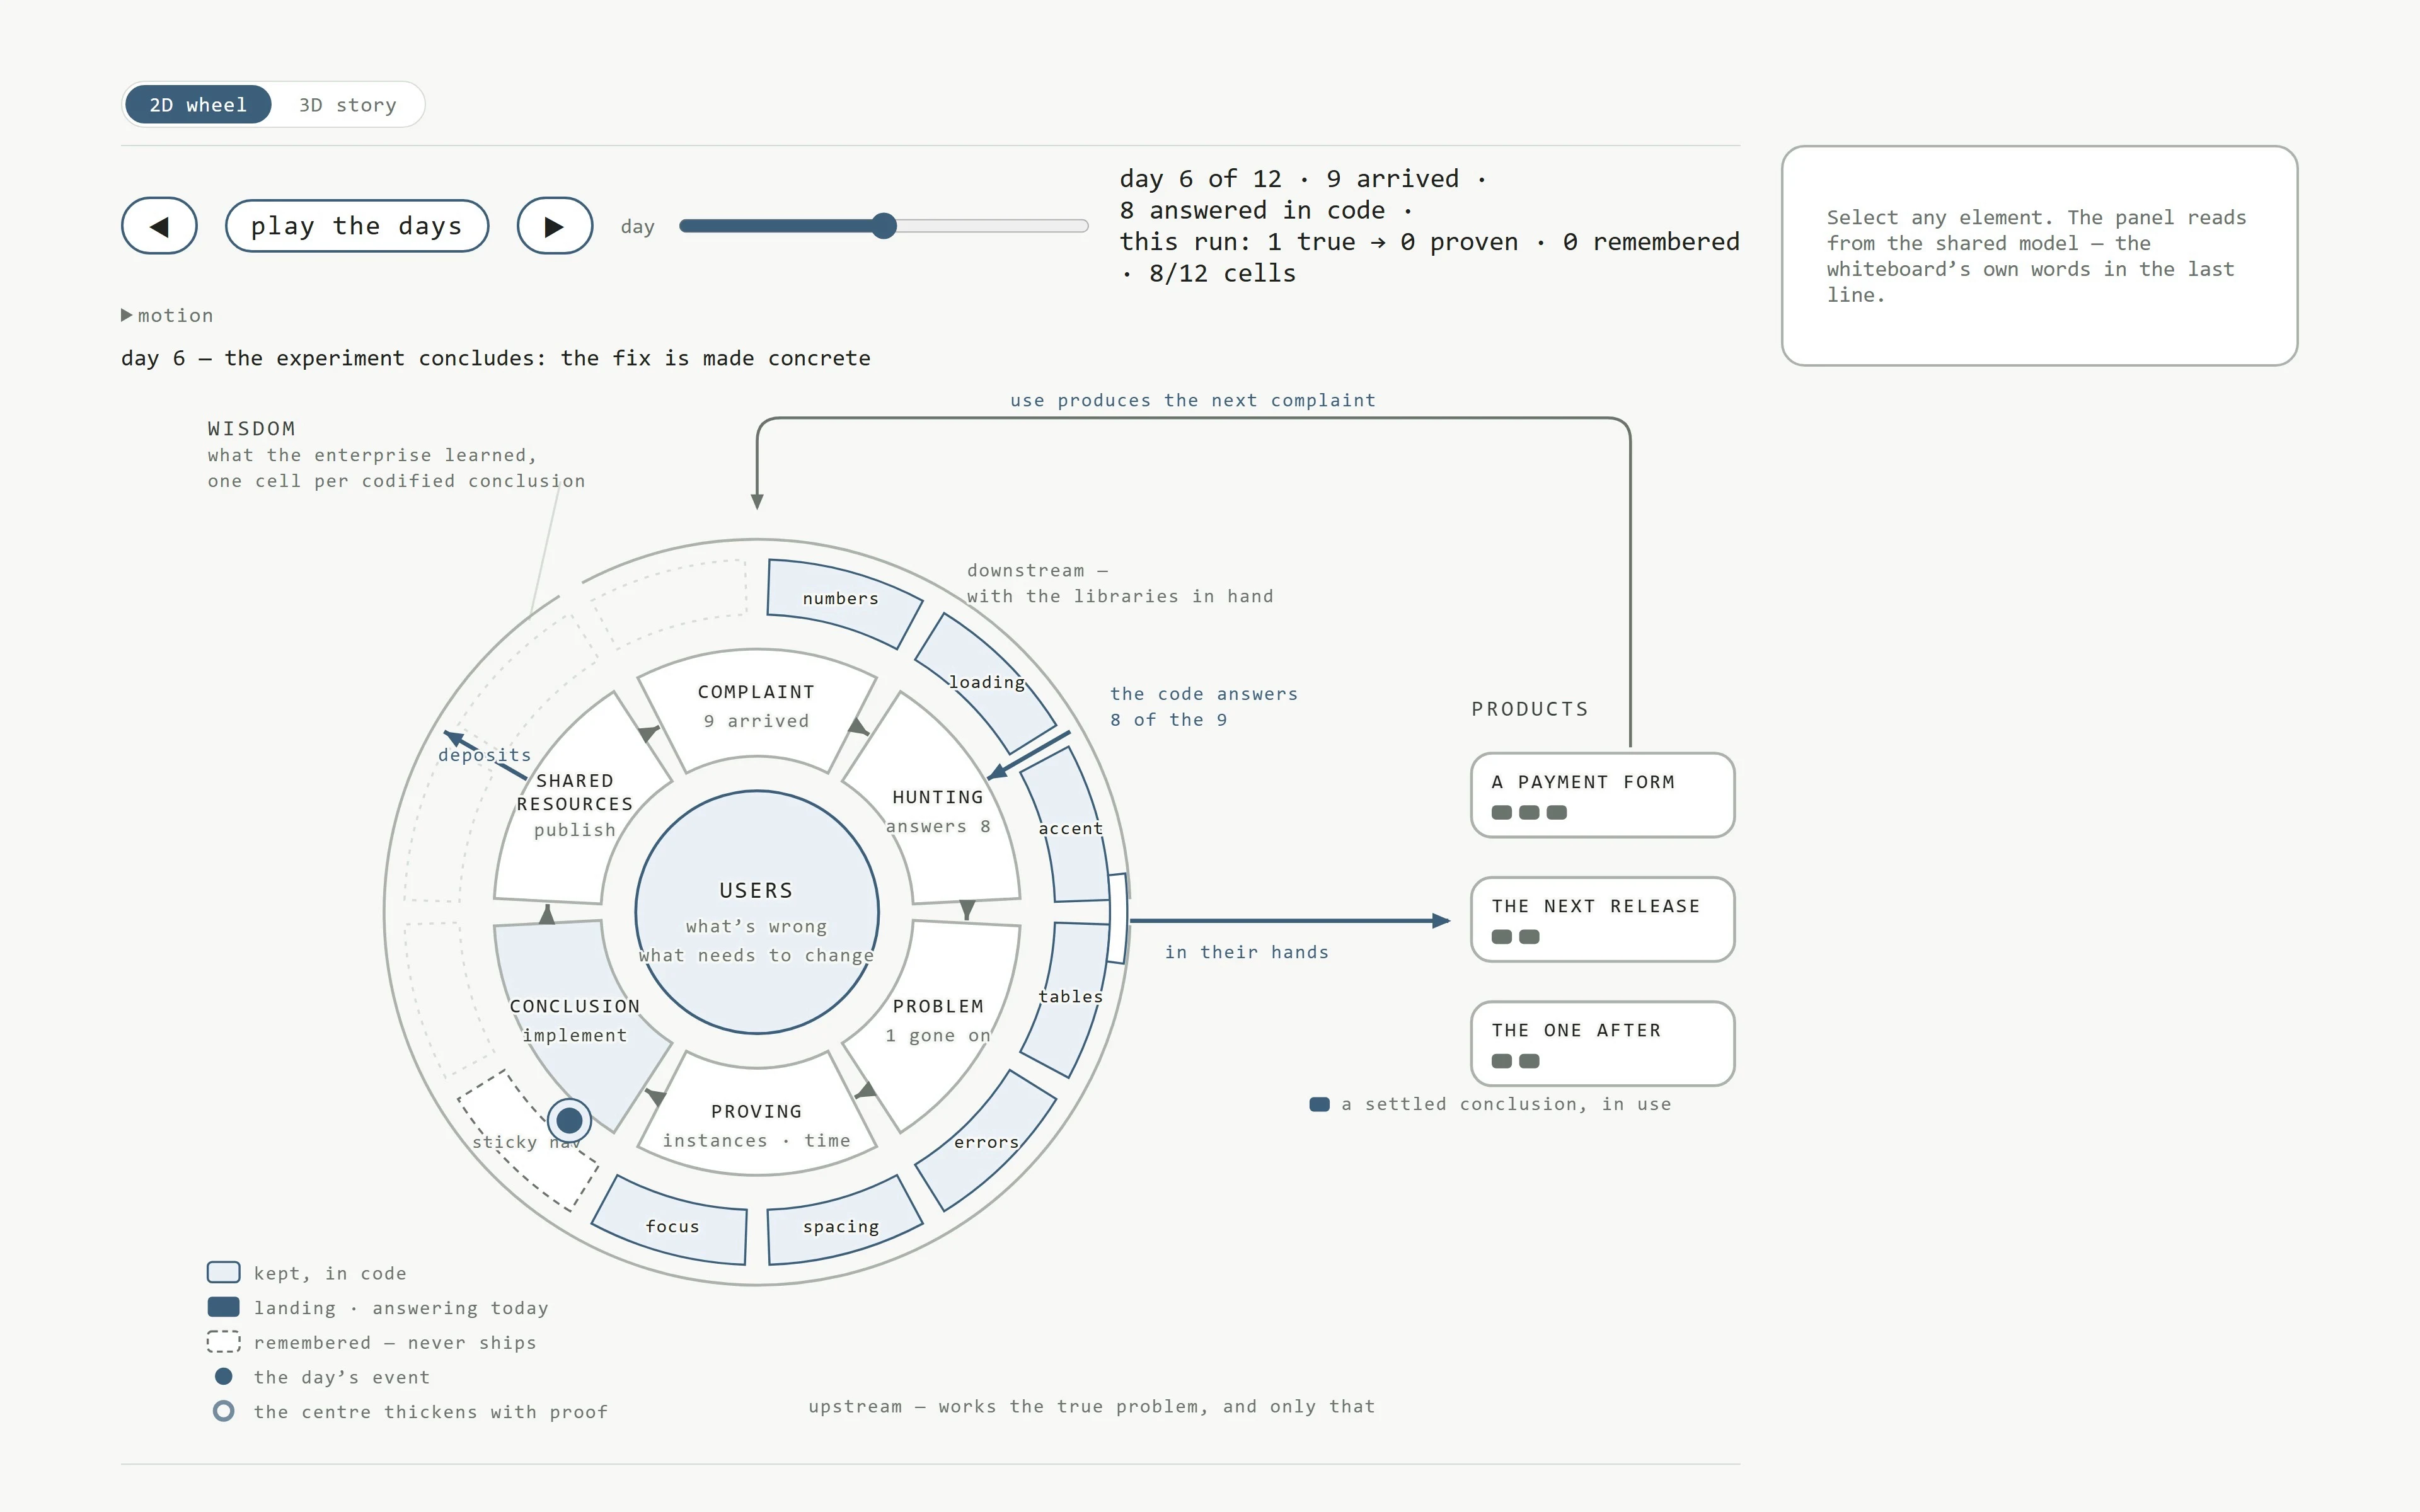
I drew my approach to product design on a whiteboard, then turned the board into a chart you can step through. Users sit at the center. Around them is a fixed ring of six stations: a complaint arrives, gets sorted into what the code already answers and what points to a real problem, the problem is named, a fix is proved over time in real use, the result is kept as a conclusion, and shared resources carry it into the products. The outer ring holds one cell for every conclusion already built into code, and that ring is the part that grows.
The chart opens on day 8 of a twelve-day run. Press “play the days” or step with the arrows; each day lights the stations it touches and says in one line what happened. Most complaints are answered by code where they land, and nobody upstream hears about them. On day 3 one isn’t, so it goes upstream; on day 7 the fix is published, the wheel turns, and a new cell lands; on day 8 the same kind of complaint comes back and the new cell answers it. Click any station or cell to read what it stands for, with the whiteboard’s own words underneath. The days and counts are made up to show the mechanism.
A toggle at the top switches to a 3D version that stacks the same days into one twisting shape, which widens each time something is published. I tried five other layouts of the same model before settling on the wheel. It was drawn to sit at the center of the next version of the presentation that started with Order StudioOrder StudioThe first version of a presentation about product decisions: one invented furniture order, followed from brief to disruption inside a working ordering prototype..