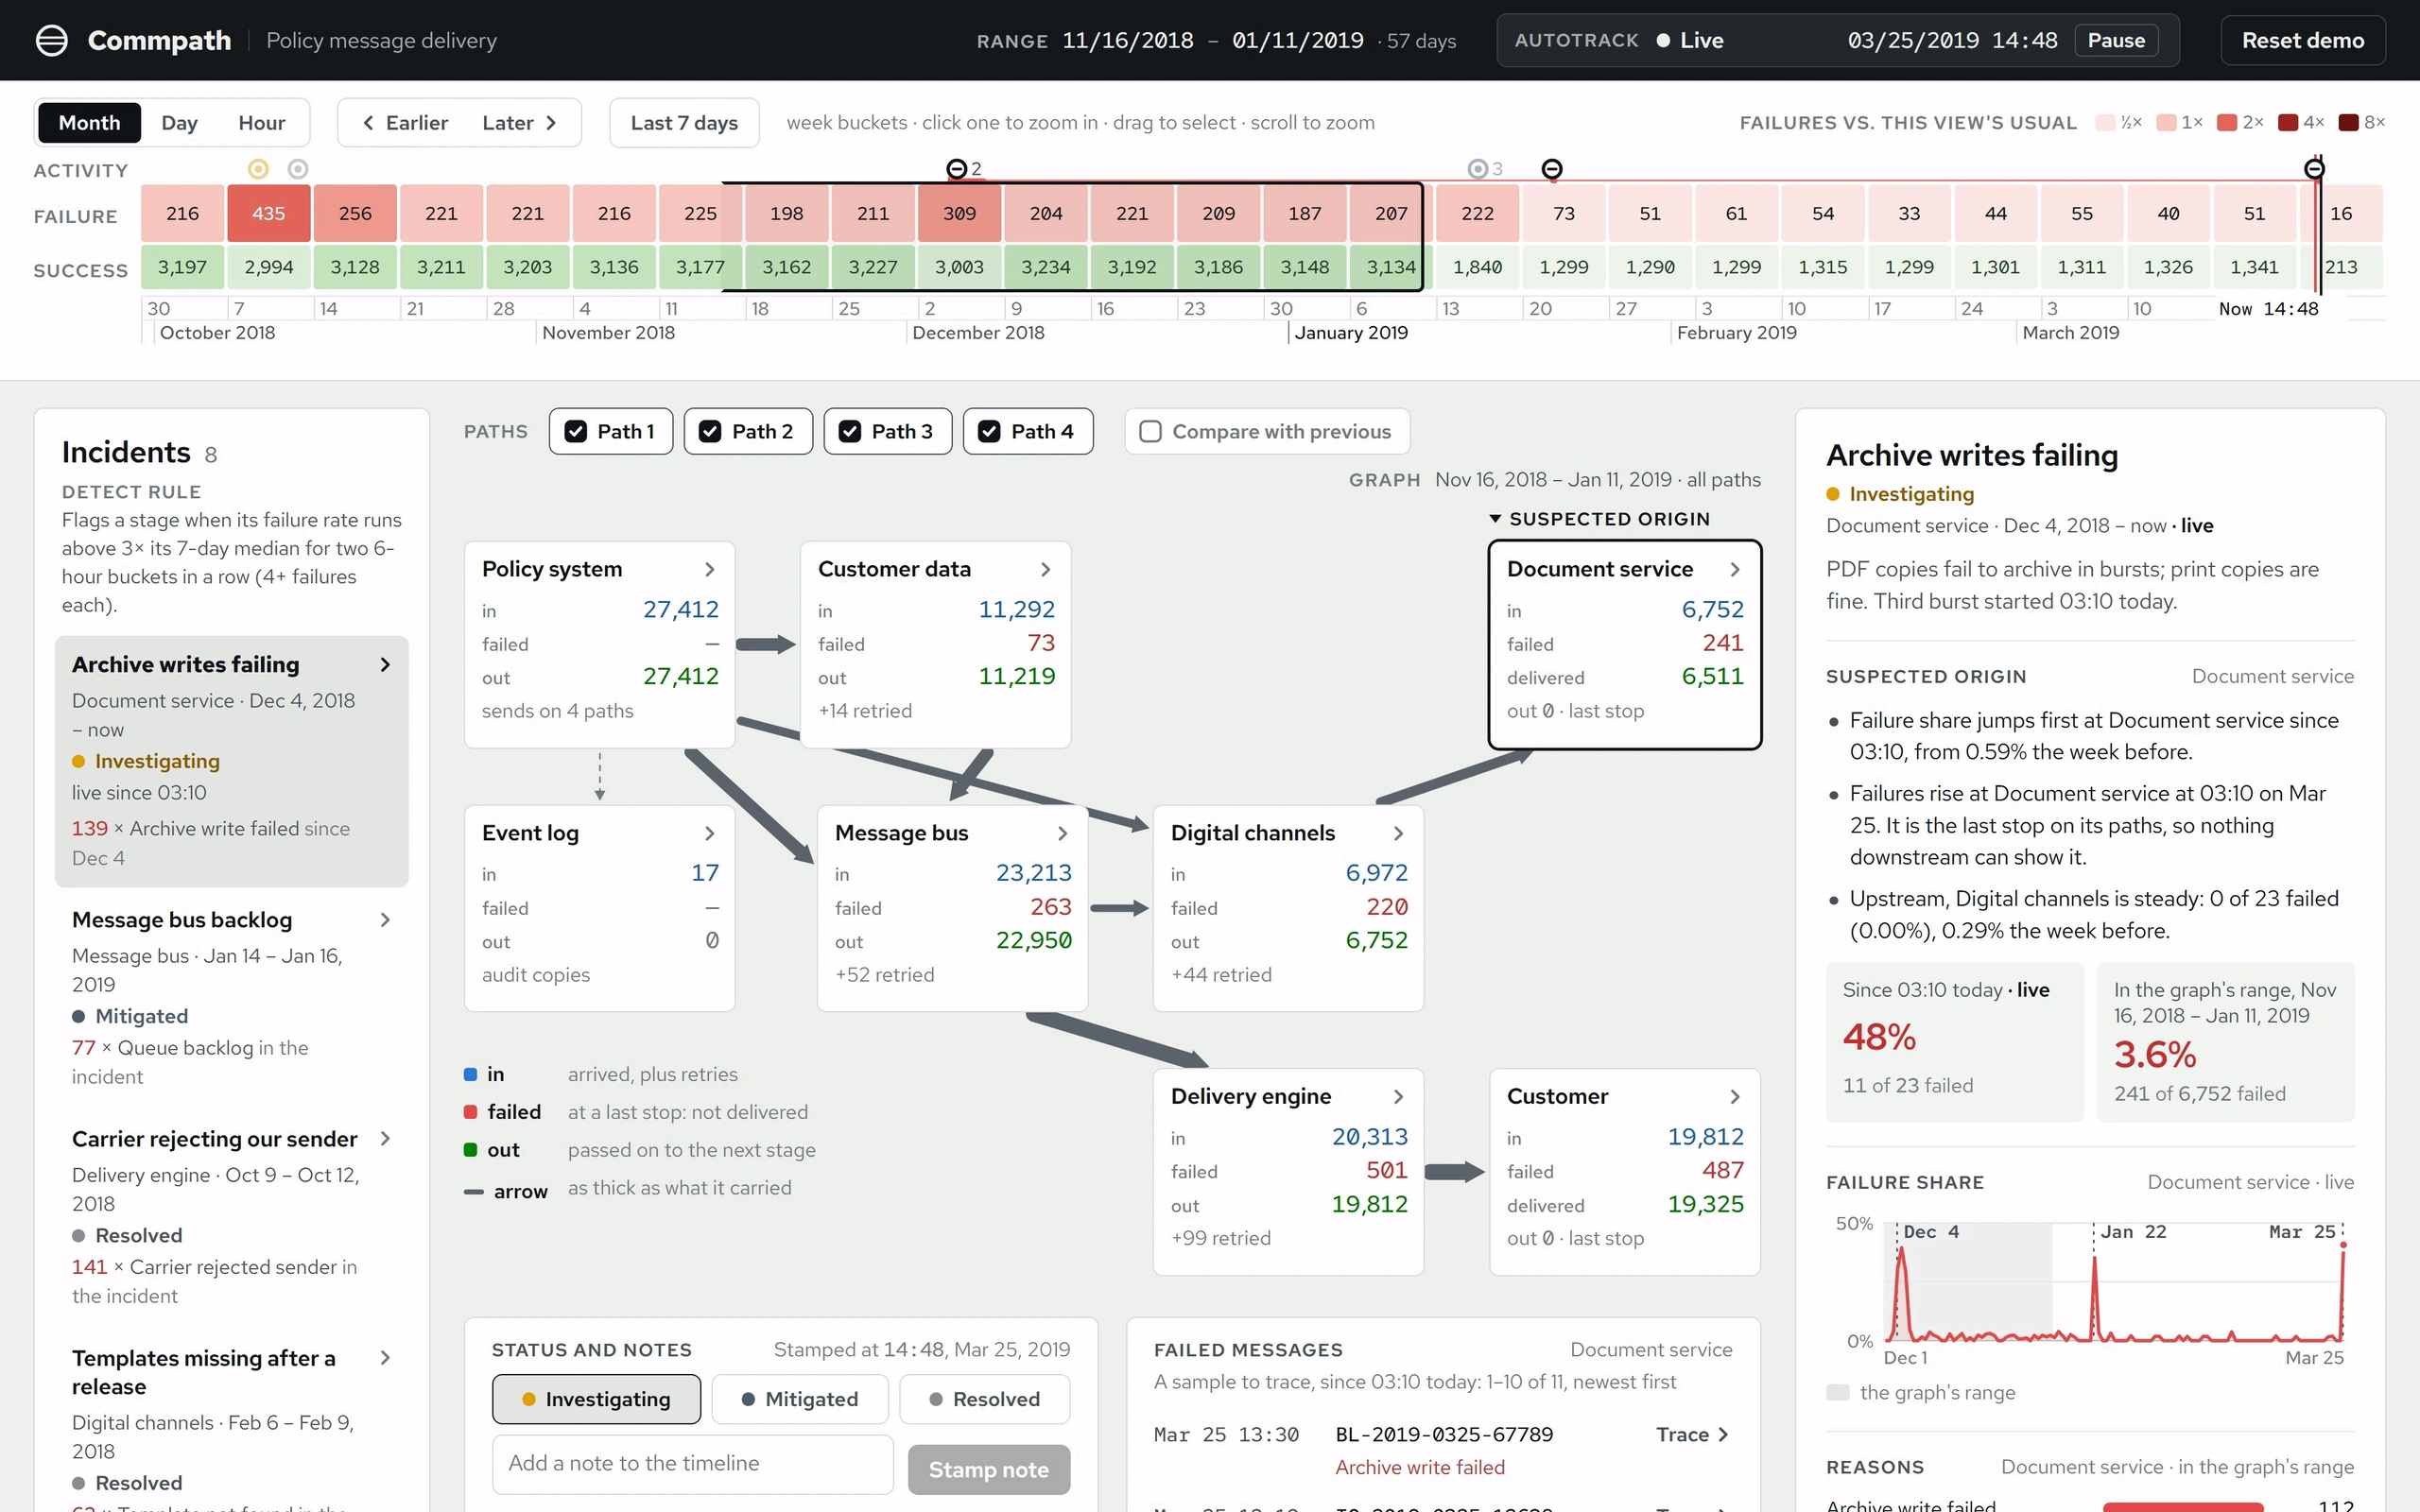
An incident investigator for an insurer’s message pipeline: a strip of failures and successes over time, zooming from months to days to hours, above a graph of eight systems from the policy system through customer data, a message bus, digital channels and a delivery engine to the customer, each showing what came in, what failed and what went out. Toggles turn four paths on and off, and an autotrack switch follows the latest data.
It runs on invented data and opens live, on an incident in progress: archive writes failing at the document service. Click a dark week to zoom to its days, then a day to its hours, or drag across the strip to choose a range, and every count follows. Any click pauses the live feed.
Open an incident and the stage where failures started is outlined as the suspected origin, with the timing that points there. Read its failure reasons and sample failed messages, trace one message hop by hop to where it failed, turn paths off to see what each carries, and mark the incident mitigated or resolved with a note that lands on the timeline.
Wireframes
How Commpath works, sketched: the job, its two working screens, one choice about where it opens, and two states.
1Spike to resolution. The job, from a dark week on the strip to a note that says what happened.2Investigate a spike. The working screen: strip on top, the pipeline in the middle, reasons and a trace below.3One message, hop by hop. Tracing one failed message to the system where it stopped.4Where it opens. Opening on the live incident instead of a summary.5Live, then paused. The live feed, and what happens the moment someone starts reading.6A path turned off. Turning a path off to see what it carries.