Copia · Creative Director · Team: +1 · Time: 3 Months (2011) · UI, Front-end
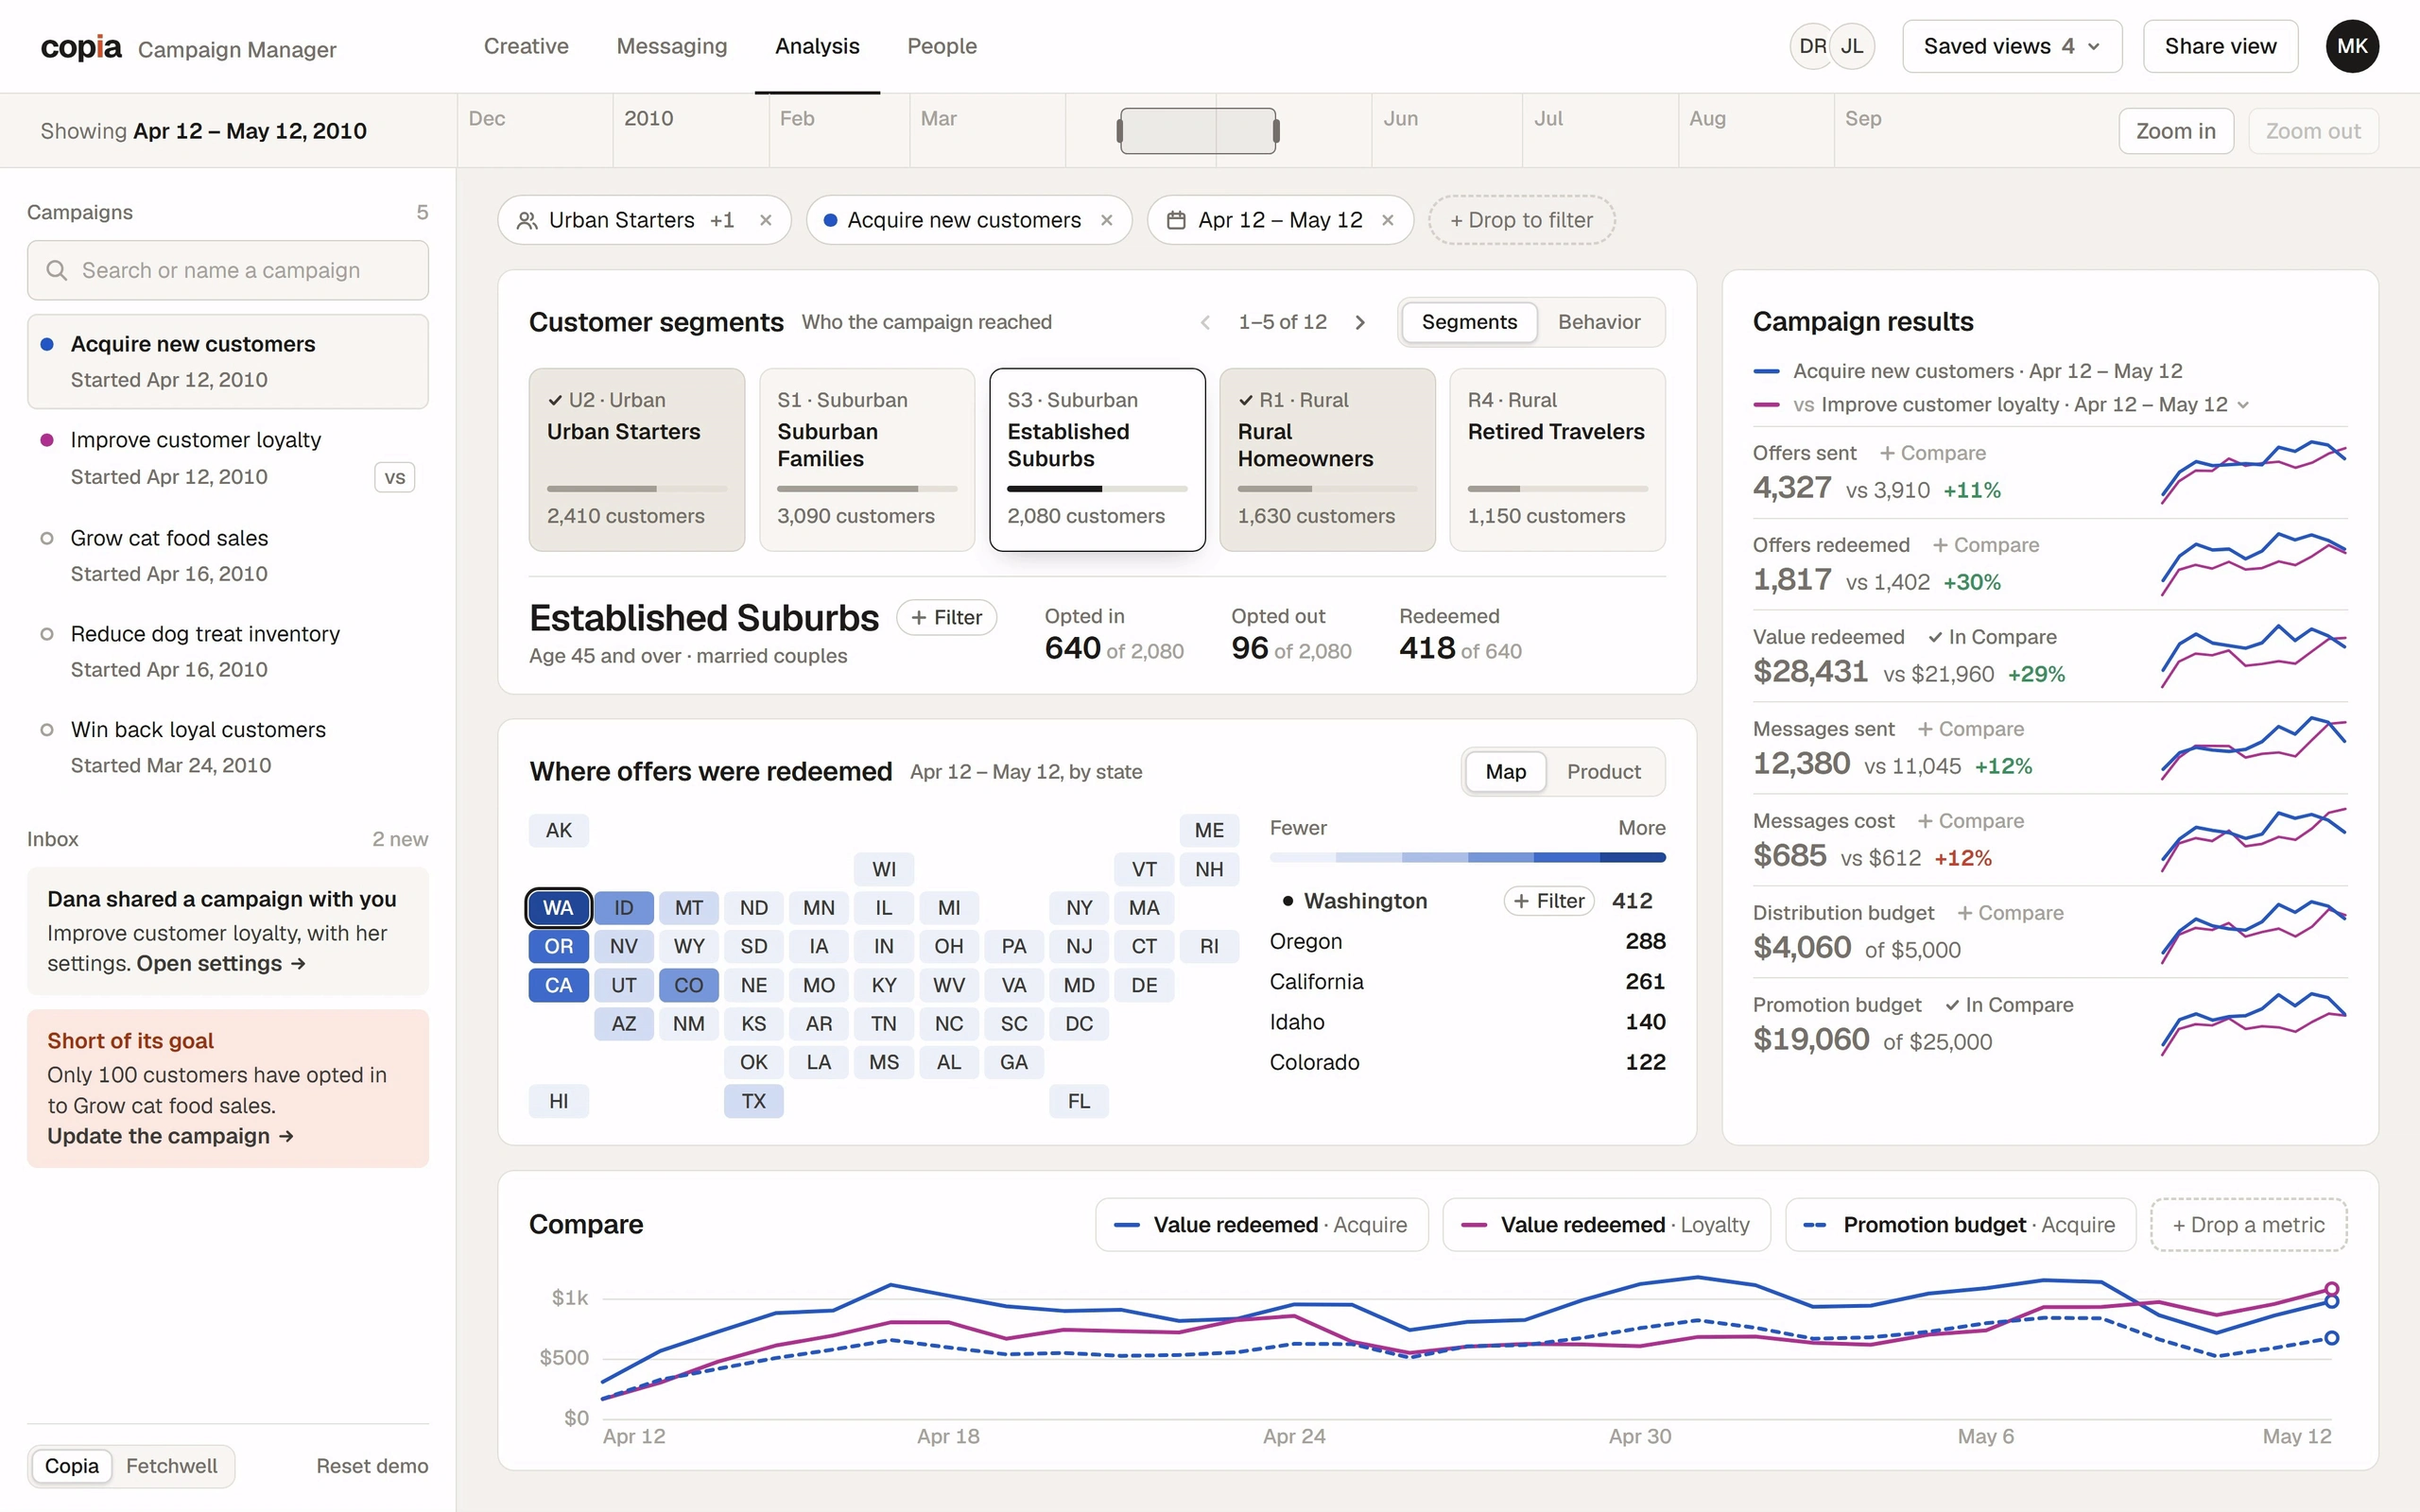
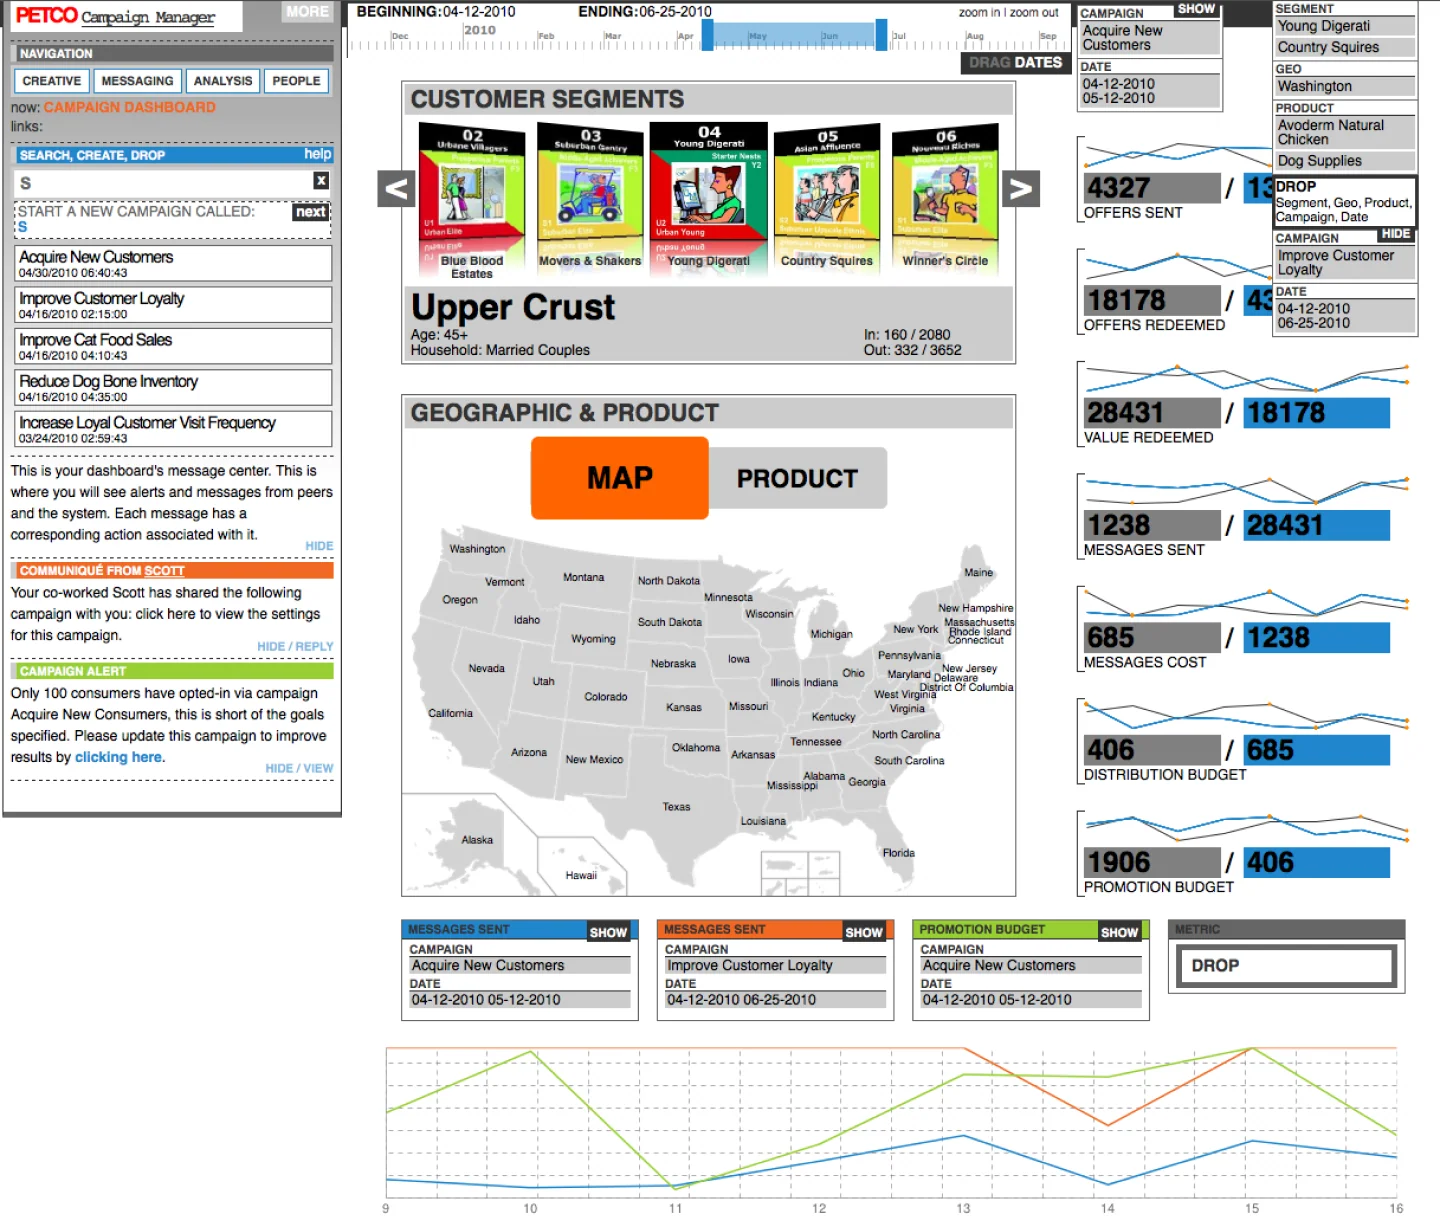
A marketing campaign dashboard, shown in two skins: one branded for a retailer and a white-label version. Campaigns are listed and created on the left; the center shows customer segments with demographic figures and a map or product view; the right column pairs offer, message and budget figures with sparklines, over a line chart along the bottom. Above is a live app on invented data: drag a campaign, a segment or a date onto the filters, brush the timeline, compare metrics, save and share a view, and switch between the retailer and white-label skins. Below, the two earlier screens.
Wireframes
How Campaign Manager works, sketched: from a question to a campaign, its two busiest views, one choice about dragging, and two states.
From a question to a campaign A flow: pick campaigns, narrow the dates, read segments and the map, compare metrics, then act by creating a campaign, composing a message, or saving and sharing the view. From a question to a campaign The job: ask about campaigns, narrow the view, then act on one. Pick campaigns Narrow the dates Read segments and the map Compare metrics Create a campaign One view Act Campaigns Dates Compose a message Save and share the view the same view, narrowed at every step 1 Narrow, then act Every step narrows the same view; nothing opens a separate report. 2 The view travels What you narrowed can be saved by name or shared as a link. 1 From a question to a campaign. From a question about campaigns to an action on one.The analysis view A wireframe of the analysis view: a campaign list with a search box at left, a timeline brush and filter chips on top, a row of customer segments over a tile map with a Map and Product toggle in the middle, key figures with sparklines at right, and a compare chart along the bottom. The analysis view One screen: pick campaigns, filter, read the segments, the map and the figures. Campaign Manager Creative Messaging Analysis People Saved views Share view Showing the dates Campaigns Segments Campaign Dates + Drop to filter Customer segments Campaign results 4,327 vs 3,900 1,817 vs 1,402 Where offers were redeemed Map Product 28,431 vs 21,960 12,380 vs 11,045 685 vs 612 Inbox 4,060 vs 5,000 Compare Value redeemed Value redeemed Budget + Drop a metric 1 Filters you can see Every filter is a chip at the top, with a place to drop more. 2 Numbers with a baseline Each figure shows the prior period and the change beside it. 3 Same height, two views Map and Product swap in place, so nothing below jumps. 2 The analysis view. The analysis view: filters on top, segments in the middle, results at right.Dates and comparison A close-up of the timeline brush with two handles and a range label, above a list of key figures and a compare chart with metric chips and a dashed Drop a metric zone, with one figure row drawn dashed as it is dragged toward the chart. Dates and comparison Two gestures: drag the dates, drop a metric. Dec Jan Feb Mar Apr May Jun Jul Apr 12 to May 12 Showing the range Zoom in Zoom out Campaign results Offers sent 1,817 vs 1,402 Compare Offers sent + Drop a metric Offers redeemed 1,817 vs 1,402 Value redeemed Value redeemed 1,817 vs 1,402 Messages sent 1,817 vs 1,402 Budget Apr 12 Apr 24 May 12 1,817 vs 1,402 1 Drag the range Every figure, sparkline and state count follows the brush. 2 Drop a metric Drag a KPI row onto the chart to compare it; its chip's × removes it. 3 Dates and comparison. Changing the dates and adding a metric to compare.Dragging, or a button too Two options side by side: filters added only by dragging a row to a drop zone, struck through, and dragging plus a visible Filter button on every draggable row, circled as the choice. How do people add a filter? Filters Drop to filter Filters Drop to filter Filter Filter Filter Filter Drag only Drag, plus a Filter button Dragging is fast once learned; the button makes the same move obvious the first time. 4 Dragging, or a button too. Every drag also has a visible button.A new campaign Two steps: the search box with Lunch typed and a menu offering a new campaign called Lunch, then the new campaign selected with empty dashed panels, the first saying to pick a campaign to see how its customers respond. A new campaign state: new, empty Type a name in the search box and create it on the spot. Typing a name Created and selected Campaigns Lunch Campaign Manager Lunch New campaign called Lunch Pick a campaign to see how its customers respond. 1 Empty, not invented A new campaign shows where its results will appear, never made-up numbers. 5 A new campaign. A campaign created from the search box, before it has results.A view worth keeping Three small panels: a save popover with a Name this view field and a Save view button; the Saved views menu with its count up by one; and a share popover whose Copy link button now reads Link copied. Below, chips show what a link holds: campaigns, filters, dates and charts. A view worth keeping state: saved, shared Save the view by name, or share it as a link. Save Saved views Saved views 5 Share Name this view Save view Link copied Copy link, until clicked Spring push The link reopens Campaigns Filters Dates Charts 1 A view is a link Save it by name, or copy a link that reopens the same campaigns, filters, dates and charts. 6 A view worth keeping. Saving and sharing a view.Mockups
1/2 Campaign Dashboard: Petco Its 2 mockups, in order:
Campaign Dashboard: Petco
Campaign Dashboard: Whitelabel