Sales Dashboard Demo
A sales agency’s dashboard on invented data: metric cards that each keep their own timeframe, a sales chart you can slice by salesperson, customer or manufacturer, and tables you can drill into.
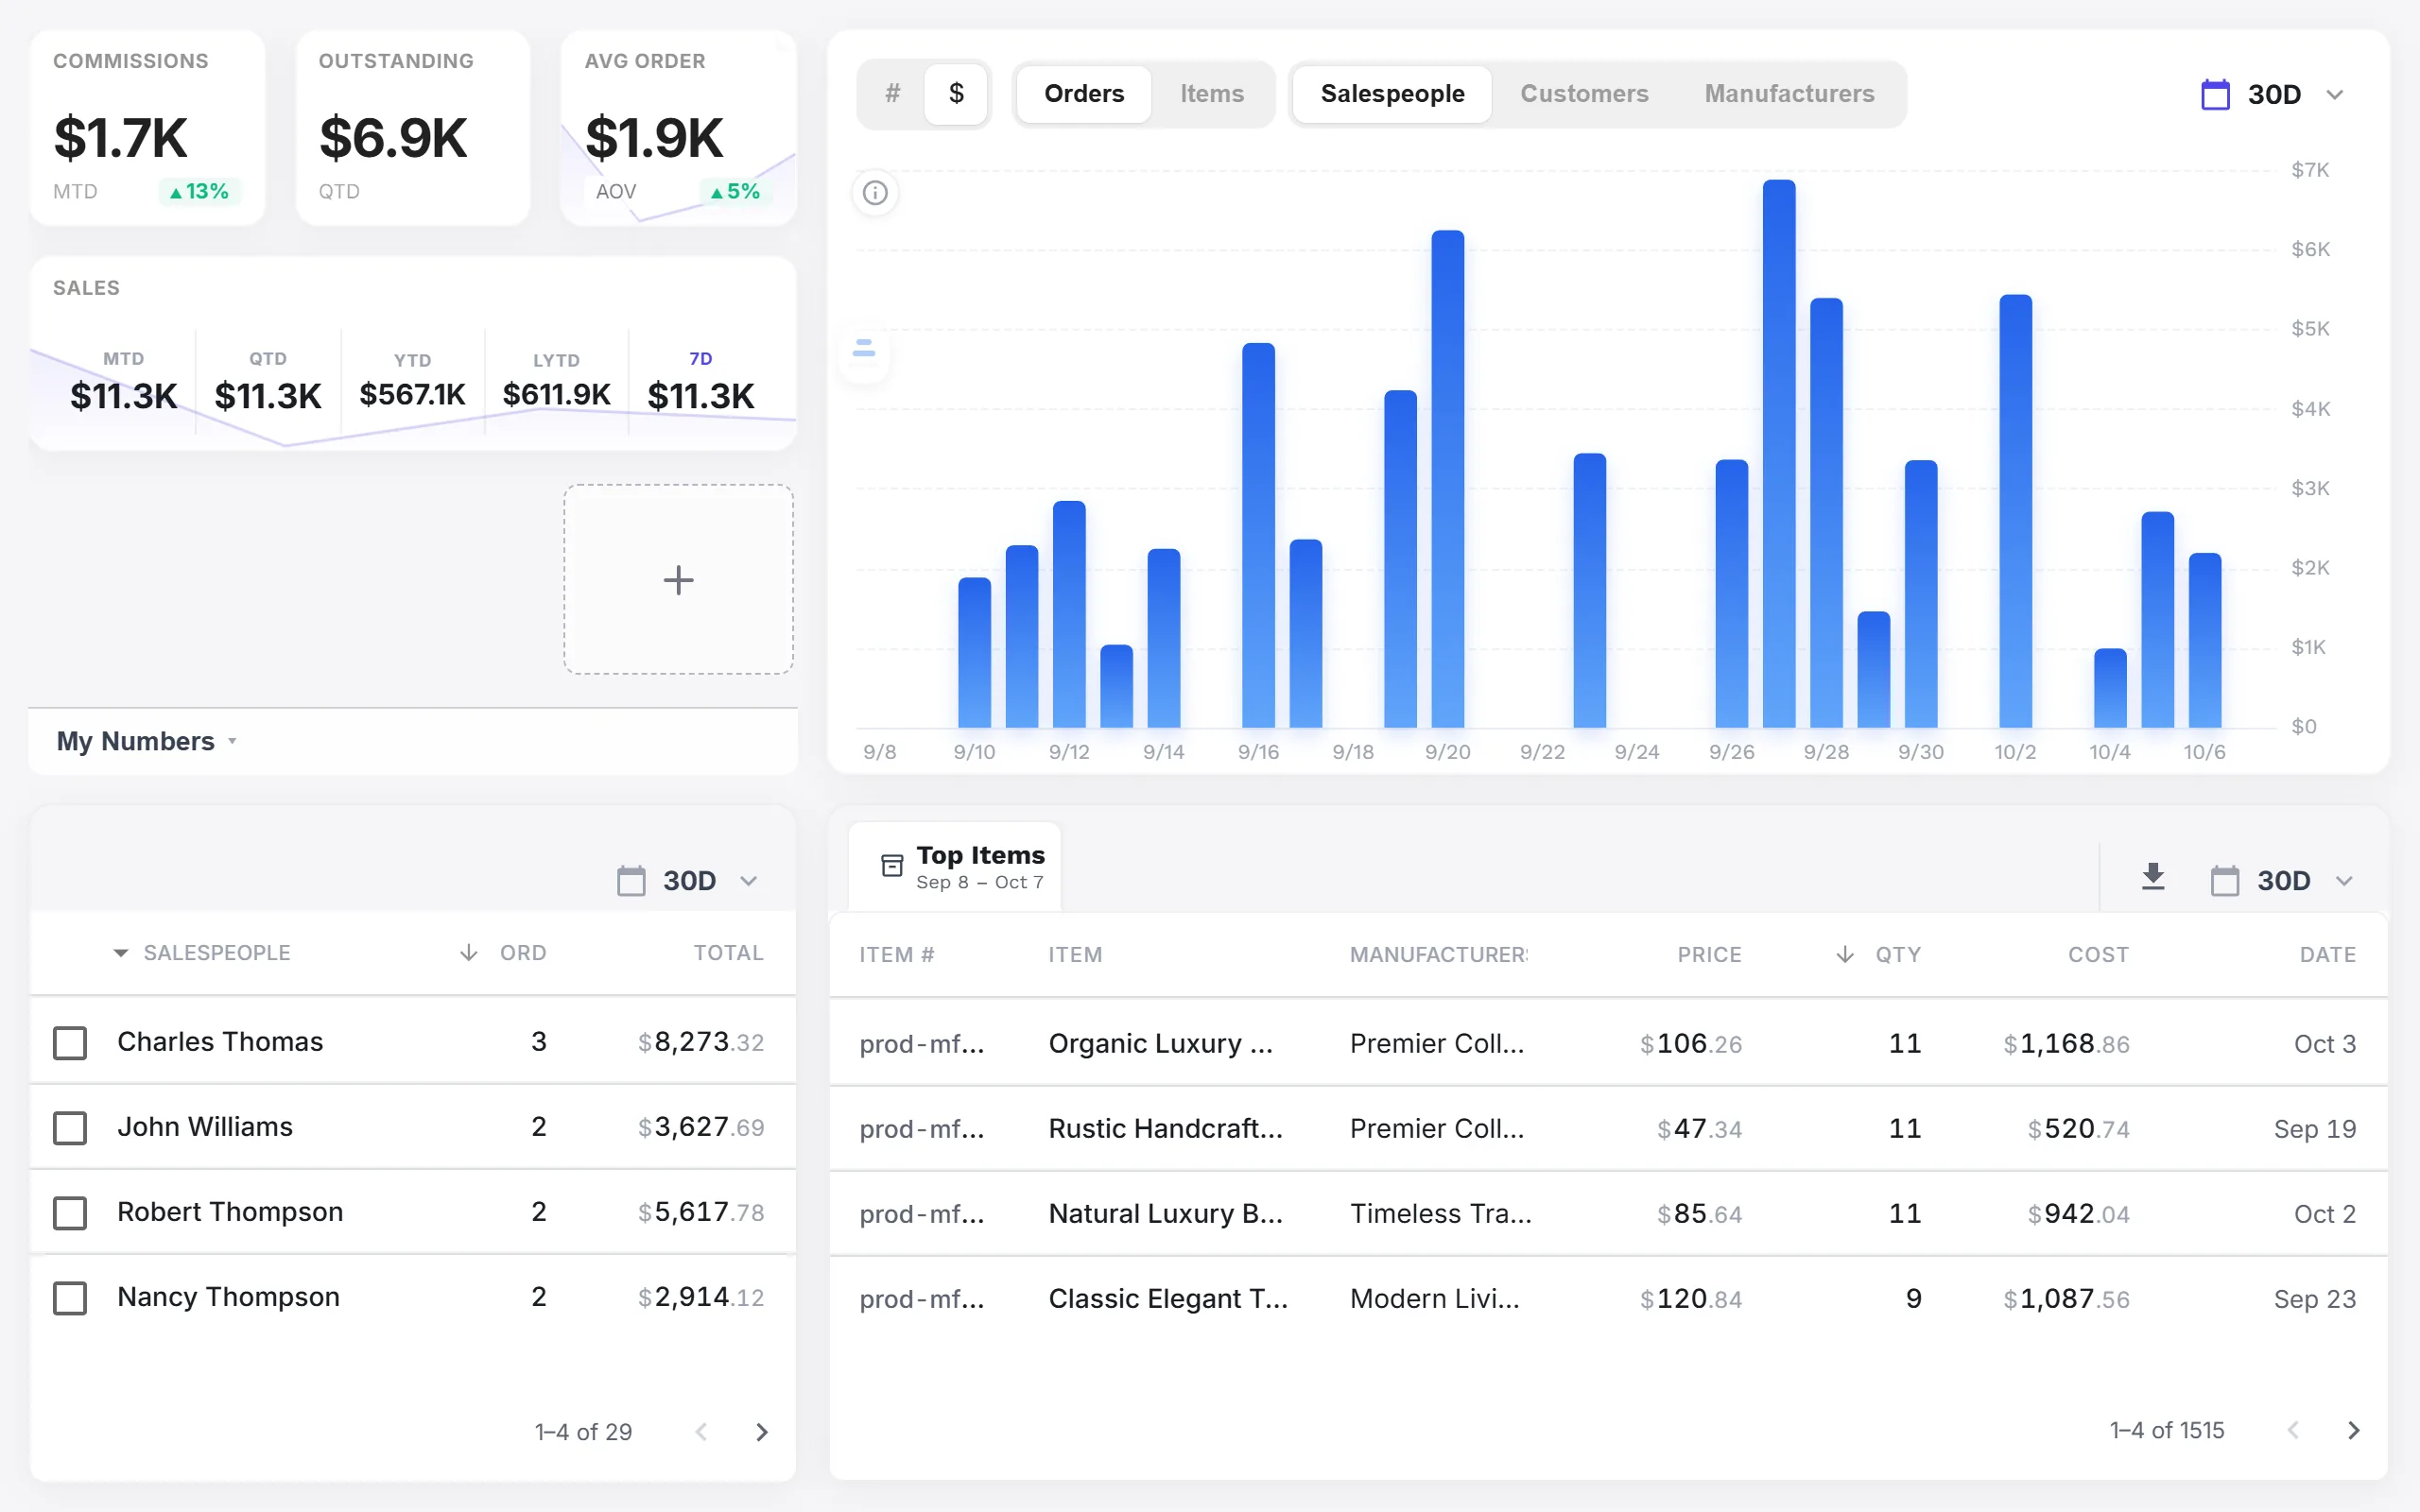
The Sales Dashboard Demo is the dashboard I designed for sales agencies, running on a generated book of business instead of a client’s data. Every order, customer and product is invented, and the dates move with today, so the numbers always look current.
The top row is metric cards: commissions, outstanding balance, average order and sales. Each card keeps its own timeframe, from the last 7 days to last year to date. The chart beside them shows orders or items, in dollars or counts, split by salesperson, customer or manufacturer. Below sit the tables: top salespeople and top items, each with its own timeframe and paging. Click a figure to drill into the orders behind it, or right-click a name for its actions.